Zahra Pouyamanesh1,
Mahsa M Amoli2,
Parichehreh Yaghmaei1,
Azadeh Ebrahim-Habibi3 ![]()
For correspondence:- Azadeh Ebrahim-Habibi Email: yaghmaei_p@srbiau.ac.ir Tel:+989122010222
Received: 8 December 2015 Accepted: 7 May 2016 Published: 28 June 2016
Citation:
Pouyamanesh Z, Amoli MM, Yaghmaei P, Ebrahim-Habibi A.
Effect of inulin supplementation in male mice fed with high fat diet on biochemical profile and α-amylase gene ex
© 2016 The authors.
This is an Open Access article that uses a funding model which does not charge readers or their institutions for access and distributed under the terms of the Creative Commons Attribution License (http://creativecommons.org/licenses/by/4.0) and the Budapest Open Access Initiative (http://www.budapestopenaccessinitiative.org/read), which permit unrestricted use, distribution, and reproduction in any medium, provided the original work is properly credited..
Purpose: To evaluate the preventive and therapeutic effects of inulin supplementation in Naval Medical Research Institute (NMRI) male mice fed with high fat diet.
Methods: NMRI male mice (n = 36) were divided into three groups. Control (C1), obese (O1) and experimental mice (E1) were fed during 8 weeks as follows: C1 with normal rodent pellet, O1 with high fat diet, and E1 with high fat diet plus 20 % inulin. C2, O2, and E2 were fed as follows: C2 with normal rodent pellets for 12 weeks; O2 with high fat diet during 8 weeks and switched to normal rodent pellet during next 4 weeks; and E2 with high fat diet over a period of 8 weeks and switched to normal rodent pellet plus 20 % inulin for 4 weeks. Body weight, serum glucose, triglycerides, total cholesterol, high density lipoprotein (HDL), low density lipoprotein (LDL), and hepatic α-amylase gene ex
Results: Groups receiving high fat diet showed higher weight (30.71 ± 0.66 g in O2, p < 0.001), non-fasting blood glucose levels (257.69 ± 5.10 mg/dl in O2, p < 0.001), TG (282.15 ± 1.83 mg/dl in O2, (p < 0.001)), and cholesterol levels (335.72 ± 2.23 mg/dl in O2, (p < 0.001)), compared with control. In C2 group, mean body weight was 25.71 ± 0.54 g, non-fasting blood level 161.54 ± 4.48 mg/dl, TG level 214.29 ± 5.54 mg/dl, and cholesterol level 164.29 ±4.57 mg/dl. Compared to obese group, mice receiving inulin showed lower blood glucose levels (223.10 ± 8.7 mg/dl in E2, p < 0.001), body weight (27.86 ± 0.57 g in E2, p < 0.001), TG (232.14 ± 4.02 mg/dl in E2, p < 0.001) and cholesterol (249.97 ± 2.28 in E2, p < 0.001). A slight decrease in hepatic α-amylase gene ex
Conclusion: Besides its sweetening properties, inulin may also find use as a potential anti-obesity compound.
Introduction
The World Health Organization (WHO) defines overweight and obesity as “extreme accumulation of body fat to an extent where it may have adverse effects on the health of the individual” [1]. Considering the global prevalence of obesity and its deleterious consequences, which ultimately leads to higher mortality rates, numerous studies are aiming at preventing and treating this condition. In order to counteract obesity, lifestyle change is recommended and includes the use of healthier diets [2] and increase of physical activity. [3]. However, implementing such changes in patients’ lives is usually difficult, and alternative therapeutic means such as drugs, are widely sought after [4]. The use of artificial sweeteners has been proposed as a way to help weight control through lessening energy intake [5]. The short-term efficacy of these compounds is clear, but in the long term, some studies report an actual weight gain associated with these compounds’ consumption [6].
Recently, a potentially more elaborated mechanism of these substances has been proposed. Based on this suggestion, these compounds would act on specific receptors, which are present in the taste buds, and in the gastrointestinal tract [7].
Inulin is a polysaccharide composed of fructose units, found in a wide variety of plants, and commercially extracted from chicory roots [8]. Fructose was previously suggested as an alternate sweetener to saccharin [9], and assumed to be a safe product when consumed moderately [10]. However, recent studies highlight the occurrence of severe adverse effects linked to its consumption [11,12]. On the other hand, inulin is considered as a “dietary fiber” which could be proposed as a potentially healthier alternative to fructose [13].
In this study, we have tested the effect of inulin consumption in a mouse model fed with a high fat diet, in order to observe the potential effect of the compound on various obesity-linked factors.
Methods
Animals and experimental protocol
Male NMRI mice (six weeks old) weighing 20 ± 5 g were purchased from the Laboratory of Animal Research Center of the Qom Branch of Jahad Daneshgahi (Iran). The mice were exposed to light/dark cycle of 12 h, and housed in standard cages at 25 °C. After one week of adaptation to the laboratory conditions, mice were randomly divided into six groups (n = 6 in each group).These groups were treated in two different settings. In both settings, mice had unrestricted access to food. In the first setting, the duration of experiment was eight weeks for the three groups C1, O1, and E1. In the second setting, the total experiment duration was 12 weeks for the three groups C2, O2 and E2.
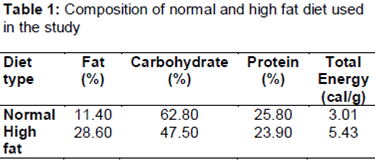
In the first setting, the C1 group (control group), received standard rodent chow, the O1 group (obese group) received high fat diet, and the E1 group (experimental group) received high fat diet and inulin. Inulin (from chicory, obtained from Sigma-Aldrich, St. Louis, MO, USA) was dissolved at 20 % in distilled water and 1mL of this solution was given to each mouse by gavage. The high-fat diet was prepared according to previously reported methods [14,15] and consisted of 150 g of mouse pellet standard chow, 100 g roasted peanuts, 100 g milk chocolate, 50 g sesame crackers and 20 g roasted sesame (). In addition, the obese group was fed 420 g creamy biscuits (1388 cal) weekly.
In the second setting, the C2 group (control group) was given standard rodent chow during the whole experimental period (12 weeks). The O2 group (obese group) received high fat diet during the first 8 weeks, and was then switched to normal rodent chow for the next four weeks (weeks 9-12 of experiment). The E2 group (experimental group) received high fat diet during the first 8 weeks, and was switched to normal rodent chow and inulin (prepared as mentioned above) for the next four weeks (weeks 9-12 of experiment).
The body weight of mice was measured at the end of the eighth and twelfth weeks in first and second settings respectively. At the end of the experiment, the animals were anesthetized and sacrificed Blood samples were collected and immediately centrifuged at 4 °C in anticoagulant-coated centrifuge tubes (Greiner, Germany) to collect the serums. All experimental protocols were performed in accordance with the international guidelines set out in the Guide for the Care and Use of Laboratory Animals (Institute of Laboratory Animal Resources) [16]. Ethical approval (no. 176948) was provided by the Ethics Committee of the Department of Animal Biology at the Science Faculty of Science and Research Branch, Islamic Azad University, Iran.
Determination of biochemical parameters
Total cholesterol, triglyceride, HDL, LDL and blood glucose of animals serum were measured using appropriate biochemical kits based on enzymatic methods (Pars Azmoon, Iran) as per manufacturer’s instructions. The animals were not fasted, and all biochemical parameters are indicative of a non-fasting state.
Determination of α-amylase gene expression
Livers were separated after mice were sacrificed. Liver tissue was washed 3 times by cold PBS and 500 mg weighed tissue was transferred to sterile microtubes (Eppendorf, Germany). 1 ml of Tris/HCl (TB; pH 7.5, 20 mM) with 0.3 mmol/L of phenylmethylsulfonyl fluoride (PMSF) and 1 mmol/L of benzamidine chloride (all chemicals from Merck, Germany), were added to the tubes and the tissues were homogenized. The suspension was centrifuged for 20 min at 1500 rpm and supernates were separated. The resulted extracts were stored at -80 °C for RNA extraction. Total RNA was extracted from hepatocytes by using Trizol (Invitrogen, USA) in a standard protocol and RNA purity was assessed by the 260/280 ratio by a NanoDrop 2000C (Thermo Scientific, USA). From each sample, up to 250 ng of total RNA was subjected to complementary DNA synthesis random hexanucleotide primers and Revert AID First Strand cDNA Synthesis kit (Fermantas, Vilnius, Lithuania). Quantitative RT-PCR (duplicate assays) was performed on the obtained cDNA and HPRT housekeeping gene was used as internal control. The primer pair sequences were 5´-GTG ATT AGC GAT GAT GAA CCA G-3’, 5´- GCA AGT CTT TCA GTC CTG TCC-3´ for HPRT and 5´-AAGATGTCCTACTTAAAGAACTGG-3´, 5´-ACCCGTGTGAAACCATAAGG-3´. Reaction was set by mixing 30ng cDNA, 10 µL RT2 Real-TimeTM SYBR Green/ROX PCR Master, primer pairs and nuclease-free water to 20 µL. Thermal condition was used for 40 cycles consisting of initial polymerase activation step at 95 oC for 10 min, followed by cycles of denaturation at 95 oC for 5 s, and finally annealing and extension at 61 oC for 40 s. Subsequently for melting curve analysis, the PCR was continued by further steps including: 95 oC for 15 s, 61 oC for 15 s, and 95 oC for 15 s. For all steps, ABI step One TM quantitative PCR system was used (Applied Biosystems, CA, USA).
Statistical analysis
Data are reported as mean ± standard deviation (SD), and were analyzed by SPSS, (version 15.0, SPSS Inc., USA) with the use of Analysis of Variance method (ANOVA), Fisher's least significant difference (LSD) and Tukey's test. Significance level was set at p < 0.05.
Results
Body weight
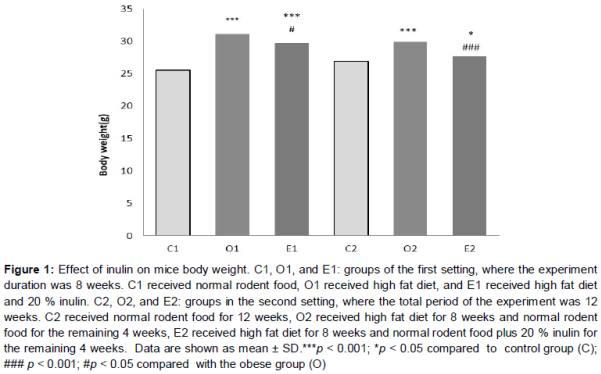
A significant weight gain was observed in the obese group O1 at week 8 of the experiment in comparison to its control group C1 (p < 0.001). The O2 group showed also a significant weight gain at week 12 of experiment in comparison to its control group (C2) (p < 0.001) (). On the other hand, consumption of inulin, both in the preventive and treating modes (E1 and E2 respectively), caused a decrease in weight gain (E1, p < 0.05), or an increase in weight loss (E2, p < 0.001) compared to the respective untreated obese groups (O1 and O2, ). Body weight of the E1 group has a significant difference with the C1 group (p < 0.001) and body weight of E2 group has a significant difference with the C2 group (p < 0.05). This comparison of E1 and E2 groups with their respective control groups show that taking inulin could not revert the obese state back to normal.
Blood glucose
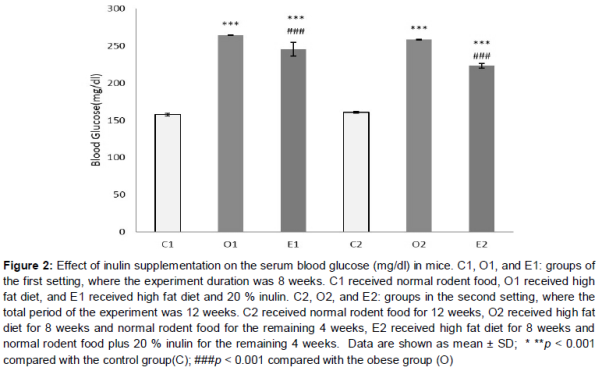
On consumption of high fat diet, blood glucose levels had significantly increased in the obese groups O1 and O2 compared to their respective control groups (p < 0.001, ). Inulin supplementation led to lower levels of blood glucose in both E1 and E2 groups in comparison to obese groups (p < 0.001, ). However, in E1 and E2 groups, blood glucose levels were higher than their respective control groups (p < 0.001, ).
Lipid profile
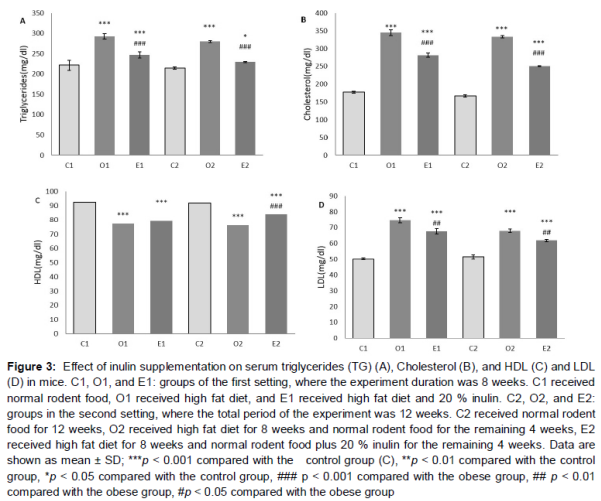
The serum triglyceride (TG), LDL, and cholesterol levels of the O1 and O2 groups became significantly higher than their respective control groups, while HDL levels were lower (p < 0.001, ). In the E1 and E2 groups that were taking inulin, the lipid profile was different with the obese groups. More specifically, for TG, cholesterol, and LDL, E groups had significant differences relative to their obese counterparts (p < 0.001 for TG and cholesterol, and p < 0.01 for LDL). TG, cholesterol and LDL levels of E groups showed significant difference with their respective control groups. The p-value was p < 0.001 in all groups, save for E2 compared to C2 were it was p < 0.01. HDL levels of the E1 group had no significant difference with O1, while in the E2 group, HDL levels had increased significantly (p < 0.001 in comparison to O2) ().
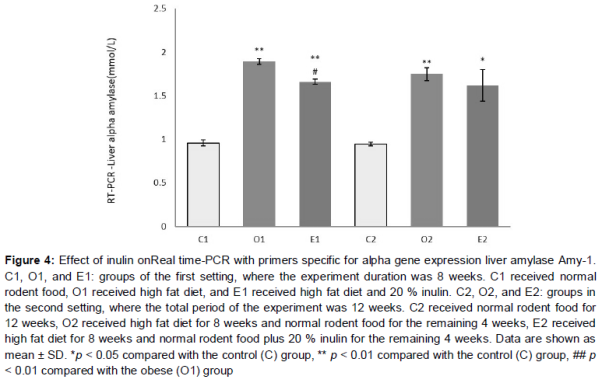
α-Amylase gene expression
Obese groups showed a significant increase in their liver alpha-amylase gene expression levels (p < 0.01 in comparison to control groups, ). Inulin supplementation caused a difference in alpha-amylase gene expression level only in the E1 group. In the e1 group, there was a significant decrease of gene expression level compared to the O1 group (p < 0.05). Alpha-amylase gene expression levels were significantly higher in E1 and E2 in comparison to the control groups (p < 0.01 and p < 0.05 respectively).
Discussion
Inulin is an indigestible polymer formed by fructose units, and a “dietary fiber”. Dietary fibers delay the processes of gastric emptying and small intestinal transit time [8]. Addition of dietary fibers to a high fat diet exerts a preventive effect on weight gain, and lowers blood glucose levels [17]. In our study, similar preventive effects were observed on weight gain and blood glucose levels of the mice that received inulin together with their high fat diet.
However, inulin is also showing a “therapeutic” effect , when it acts as an aid into dropping weight and decrease of blood glucose levels in mice that are already obese after consuming a high fat diet. Other properties have been previously reported for inulin including antioxidant and hepato protective activity [18], cyto protection against corticosteroid [19], and immune modulator function with a potential to be used in vaccines [20] or as an aid in cancer treatment [21]. As so, inulin may be considered to be a functional nutriment [22].
A very prominent feature of inulin is a prebiotic property, which is being related to different manifestations of its effect with regard to the gastrointestinal tract, including a beneficial effect on intestinal bacteria that may provide health-promoting effect to their hosts [23]. The use of inulin has been shown to improve lipid metabolism in rats that were fed a high fat diet [24]. Our results are also showing that inulin can correct an impaired lipid profile.
Inulin is also a “prebiotic”, which increases the growth and activity of specific intestinal bacteria. The result of prebiotic supplementation is an improvement of gastro-intestinal problems [23]. Numerous studies suggest a link between the gut microbiota composition and obesity. In many reports, a difference has been observed between the dominant microbiome phyla of obese and lean mice. Accordingly, changing the microbiota composition through direct administration of bacteria (probiotics) or indirect effect of prebiotics leads to weight loss [24]. In a recent study, the use of inulin has been shown to affect the gut microbiota of rats that were fed a high fat diet, and improve lipid metabolism [25]. Our results are similarly showing that inulin can correct an impaired lipid profile.
Finally, a slight inhibitory effect in alpha-amylase gene expression was observed when inulin was taken with a high-fat diet. The obese mice have elevated levels of alpha-amylase gene expression, and decreasing these levels may have an anti-obesity effect. However, this is a hypothesis that needs further verification in future studies.
Conclusion
Inulin, which has been observed to positively affect several unpaired biochemical parameters of obese mice, may be used as an adjuvant to other therapies, to achieve both preventive and therapeutic management of obesity.
References
Archives


News Updates